

How to Read Crypto Charts: Simple Technical Analysis for Starters
For beginners entering the world of cryptocurrency, learning how to read crypto charts is one of the most crucial early steps. These charts form the foundation of technical analysis — a method used to anticipate price movements based on historical data. Whether you’re looking at Bitcoin, Ethereum, or a lesser-known altcoin, being able to interpret price patterns can give you an edge in timing your trades more wisely.
This guide offers a clear breakdown of chart components, common indicators, pattern recognition, and practical trading strategies.
What Is a Crypto Chart and Why Does It Matter?
A crypto chart visually displays the price movements of a cryptocurrency over time. It helps traders understand past trends, identify patterns, and predict potential future actions. While some traders rely on fundamental analysis — examining news, adoption, or technological developments — others lean on technical analysis, which focuses purely on data from the charts themselves.
The real power lies in combining both approaches, but knowing how to read a chart is the technical trader’s starting point.
Basic Components of a Crypto Chart
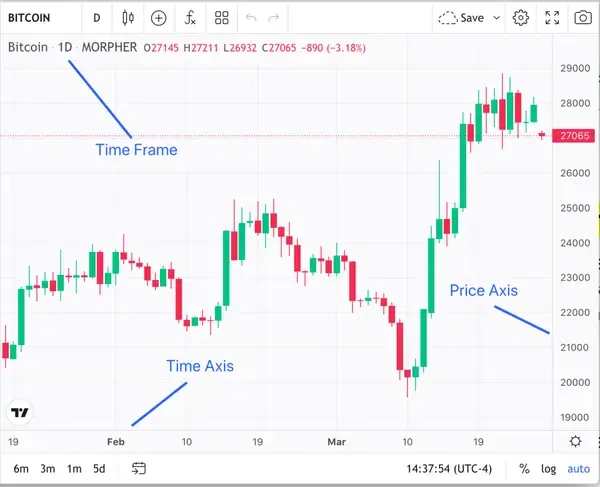
Credit from Morpher
Crypto charts typically consist of several key features that represent price data and market activity. Understanding these is critical before diving into patterns and strategies.
- Candlesticks: Each candlestick shows the price action for a specific time frame (e.g., 1 hour or 1 day). It includes the Open, High, Low, and Close prices (OHLC).
- Colors: A green (or white) candle typically means the price went up in that time frame. A red (or black) one means it went down.
- Timeframes: You can view charts in time intervals such as 1-minute, 1-hour, 4-hour, daily, or weekly. Shorter timeframes are used for day trading; longer ones for investing or swing trading.
- Volume Bars: Shown below the main chart, these indicate how much crypto was traded during a specific period — useful for confirming trends or breakouts.
- Price Axis: The vertical axis shows the price levels, while the horizontal axis shows time.
How to Read Crypto Charts: Types of Crypto Charts
Different chart types offer different visual perspectives:
- Line Chart: Connects closing prices over time with a single line. Good for simplicity and seeing general direction.
- Candlestick Chart: The most popular chart in crypto trading. Each candle tells a story: the body shows the open-close range; the wicks (shadows) show the high-low range.
- Bar Chart: Similar to candlesticks but less visually intuitive. Displays OHLC without the colored candle bodies.
How to Read Crypto Charts: Reading Candlestick Patterns
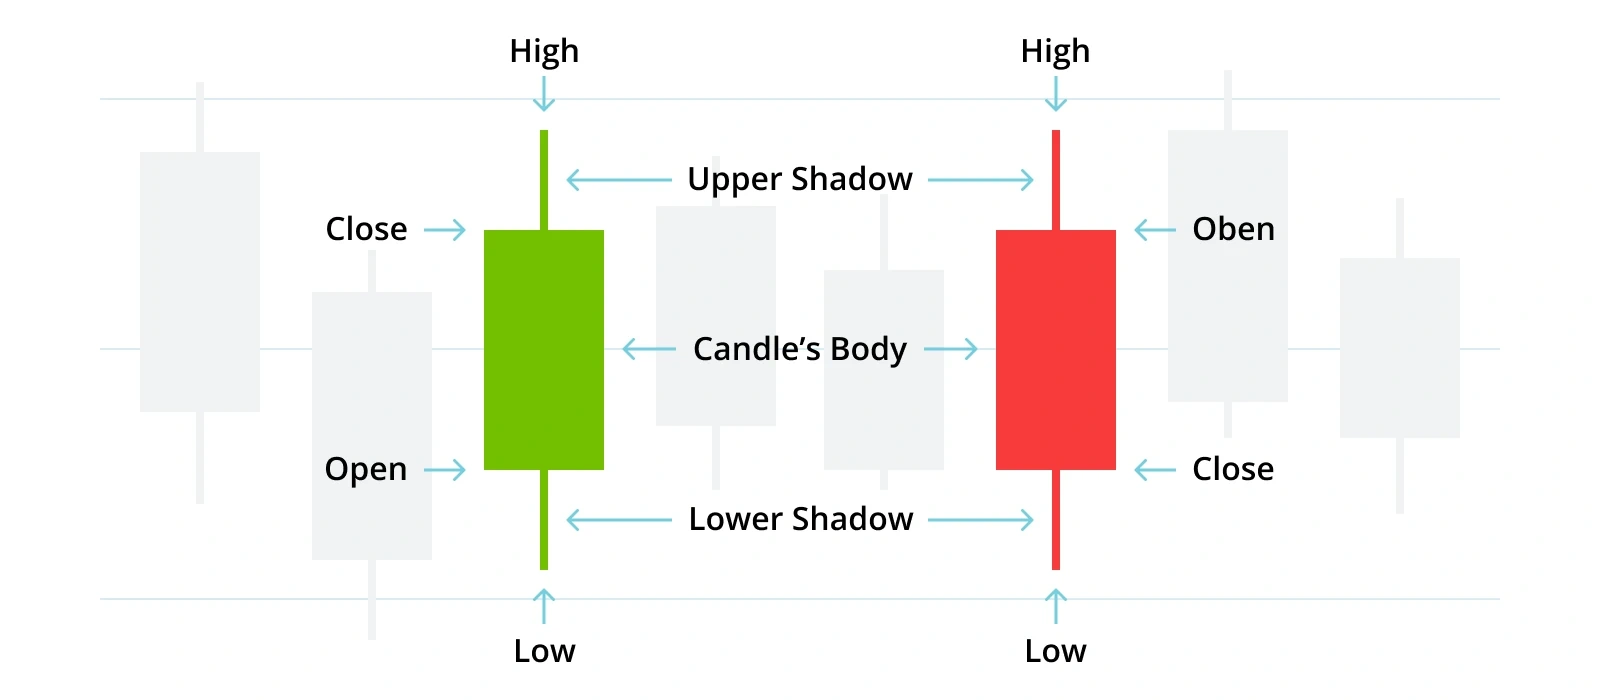
Credit from Bison
Candlestick patterns reflect market psychology and trader behavior. Certain formations repeat across markets and timeframes.
Basic Parts:
- Body: Distance between the open and close price.
- Wicks (or Shadows): The high and low within the time period.
Common Patterns:
| Pattern Type | Example | Market Signal |
|---|---|---|
| Bullish | Hammer, Bullish Engulfing | Price may reverse upward |
| Bearish | Shooting Star, Bearish Engulfing | Price may reverse downward |
For instance, a Hammer at the bottom of a downtrend could suggest buyers are entering, while a Bearish Engulfing at the top of an uptrend may signal upcoming weakness.
How to Read Crypto Charts: Understanding Trends
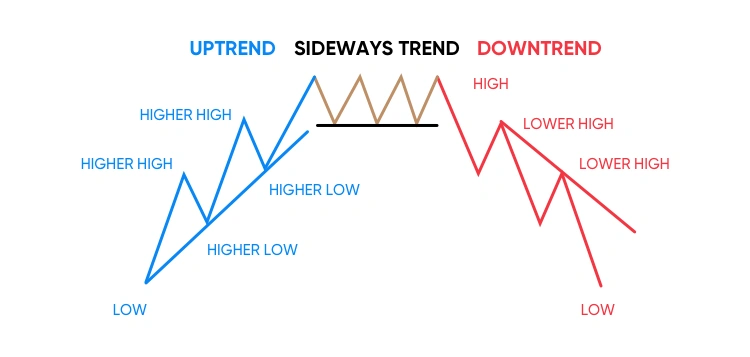
Credit from Pintu
Trends help you understand the market’s direction:
- Uptrend: Prices make higher highs and higher lows.
- Downtrend: Prices make lower highs and lower lows.
- Sideways (Consolidation): Price moves within a horizontal range.
Drawing trendlines along the highs or lows helps visually define these movements. Tools like TradingView make it easy to draw them directly on the chart.
Support and Resistance Levels
Support is a price level where the asset tends to stop falling. Resistance is where it tends to stop rising.
These levels are not always exact — they can be zones rather than precise lines. Traders use them to:
- Plan entry/exit points
- Set stop-loss or take-profit orders
- Gauge the strength of a trend or anticipate breakouts
Identifying these levels often involves drawing horizontal lines at recent price peaks or troughs.
Basic Technical Indicators for Beginners
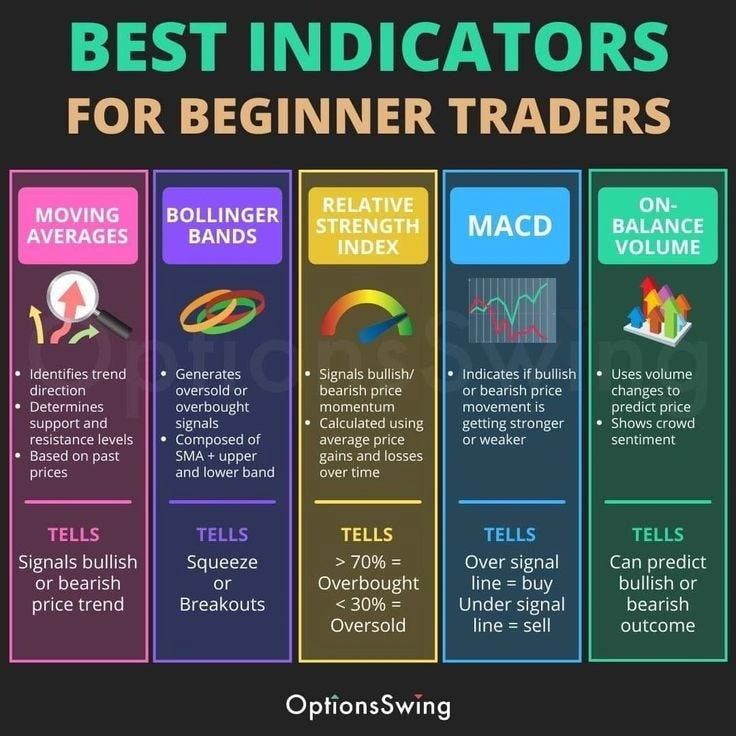
Credit from Medium
Indicators are tools that calculate and display data overlays based on price and volume. Here are a few beginner-friendly ones:
- Moving Averages (MA): Smooths out price data. A 50-day MA shows the average closing price over 50 days.
- RSI (Relative Strength Index): Ranges from 0 to 100. Over 70 means overbought, under 30 means oversold.
- MACD (Moving Average Convergence Divergence): Tracks the relationship between two MAs to identify momentum shifts.
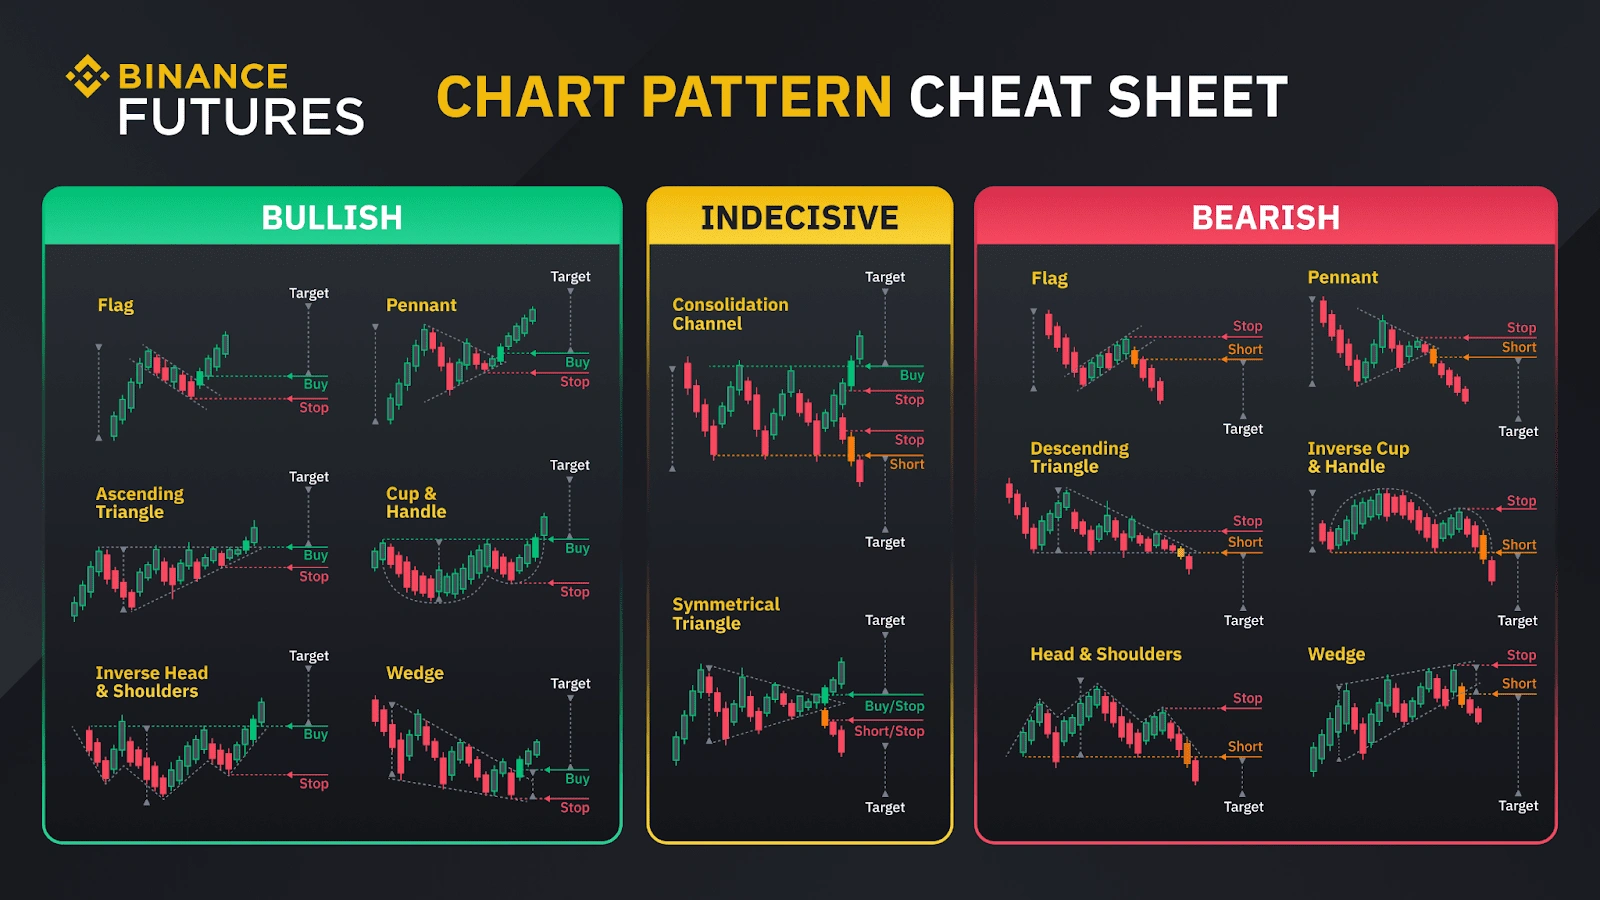
Common Chart Patterns to Recognize
Pattern recognition helps predict whether a trend may continue or reverse.
- Reversal Patterns:
- Head and Shoulders: Signals trend reversal
- Double Top/Bottom: Indicates strong resistance/support
- Continuation Patterns:
- Flags and Pennants: Brief pauses in a strong trend
- Triangles: Can signal breakout direction depending on context
Volume Analysis: Gauging Market Strength
Volume shows the number of trades during a certain period. High volume during a price move indicates strong conviction, while low volume may signal indecision or manipulation.
For example:
- Price up + high volume = strong buying
- Price up + low volume = weak move, possibly unsustainable
Setting Up Your First Crypto Chart
Credit from Binance
Here’s how to get started practically:
- Choose a Platform: TradingView and Binance are popular options. Both offer free access to basic charting tools.
- Select a Coin and Timeframe: Start with BTC/USDT or ETH/USDT on the 1-day chart.
- Switch to Candlestick View
- Add Indicators: Begin with a 50-day moving average and RSI.
- Draw Key Levels: Use the horizontal line tool to mark support/resistance.
Simple Trading Strategies for Beginners
- Trend Following: Trade in the direction of the trend. Use moving averages to confirm trend direction.
- Breakout Trading: Wait for price to break key support or resistance levels, then trade in the direction of the breakout.
Tips for Reading Crypto Charts as a Beginner
- Start Small: Use paper trading or demo accounts before risking real money.
- Set Stop-Loss Orders: Protect yourself from large losses if the trade goes against you.
- Avoid Emotional Decisions: Don’t chase pumps or panic sell during dips.
- Stay Informed: Technicals can shift quickly with news. Always check the wider market context.
Conclusion: The Value of Learning How to Read Crypto Charts
In a volatile and fast-moving market like crypto, knowing how to read crypto charts isn’t just useful — it’s essential. While no chart can predict the future with certainty, technical analysis gives you a framework to make educated decisions. Start with the basics, build your confidence through practice, and always stay grounded in the data. Over time, what once looked like random movements will begin to form stories — ones you’ll learn to read.