

Beginner’s Guide: 7 Common Trading Indicators You Should Learn First
What Are Trading Indicators and Why Should Beginners Care?
Starting your trading journey can feel overwhelming. There’s price action, charts, candles, and a million tools to choose from. One of the first things you’ll notice is how often traders talk about “indicators.” More specifically, common trading indicators—the ones almost every platform has built in.
These are mathematical tools that help you make sense of price movement. They aren’t magic wands, but they can give you clues about where the market might be headed. In this guide, we’ll break down seven of the most popular indicators—what they do and why they matter.
1. RSI – A Simple Way to Spot Market Extremes
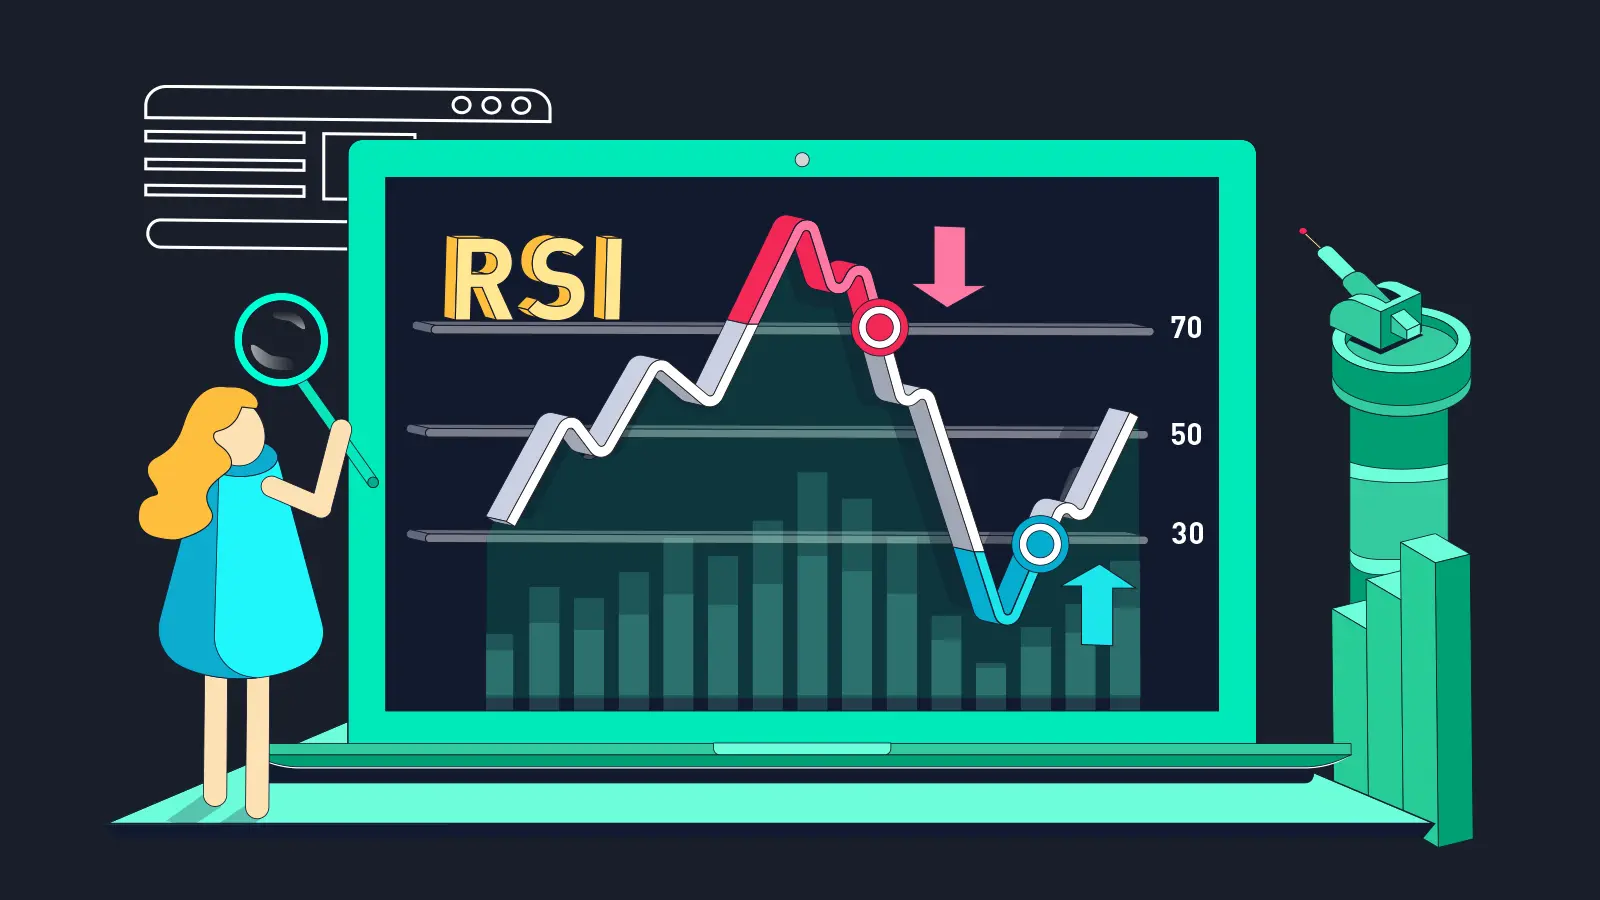
The Relative Strength Index (RSI) is one of the easiest indicators to learn. It measures momentum—how strong or weak a price move is. RSI gives you a number between 0 and 100. When it goes above 70, the asset might be “overbought.” Below 30? It could be “oversold.”
Why it’s helpful:
RSI can help you spot moments when a trend might be slowing down or getting ready to reverse. It’s not perfect, but it’s a solid first tool.
2. Moving Averages – The Core of Common Trading Indicators
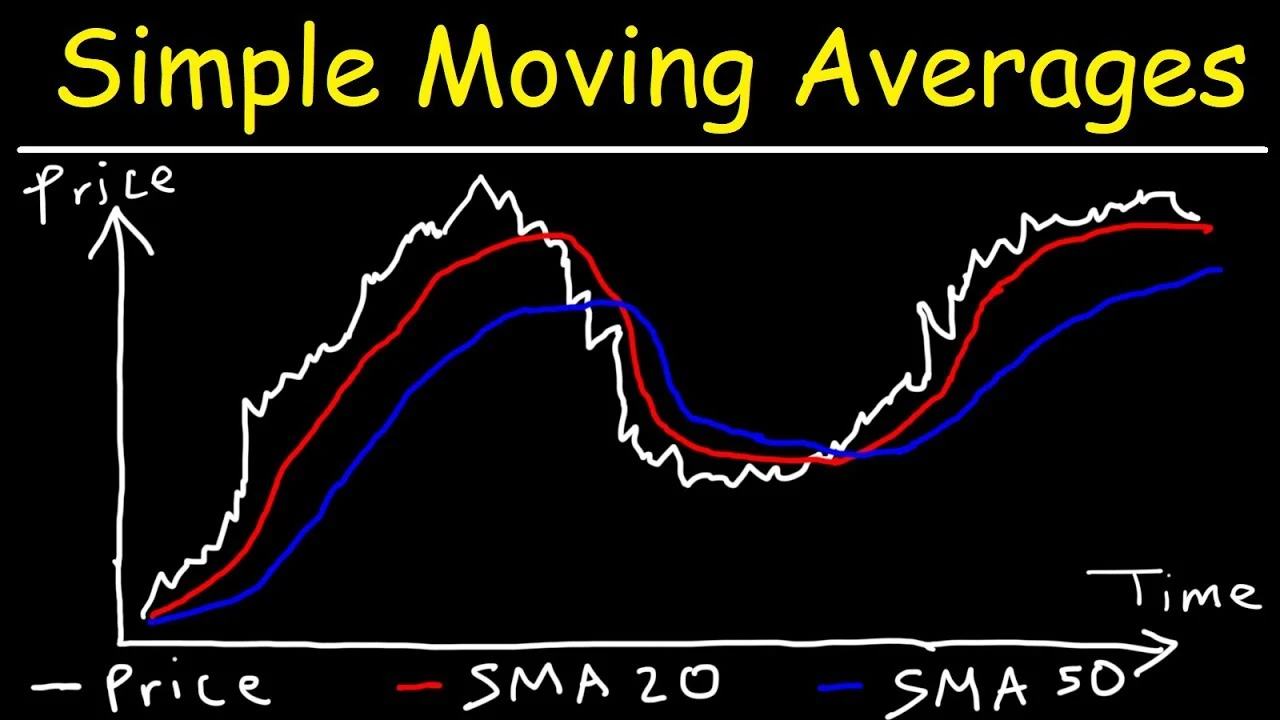
Moving Averages (MA) are everywhere—and for good reason. They smooth out price data so you can more clearly see the trend. The two types you’ll use most are:
- SMA (Simple Moving Average): Calculates an average over time.
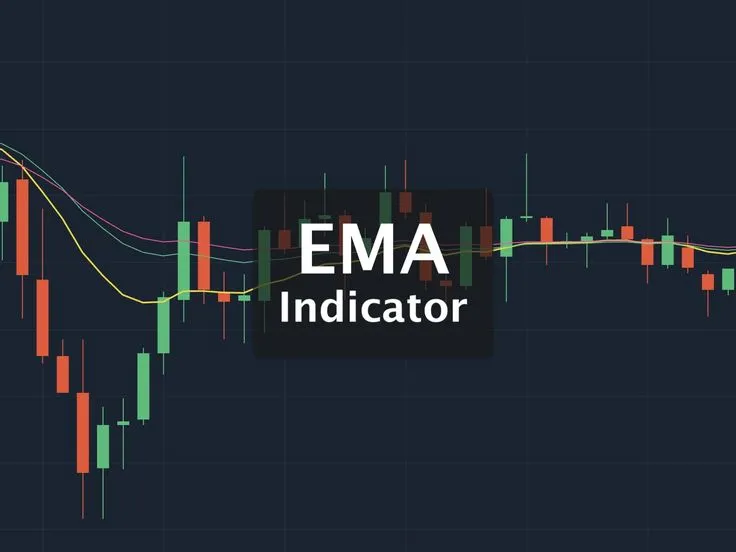
- EMA (Exponential Moving Average): Puts more weight on recent prices.
Why it’s helpful:
Moving averages help you understand whether an asset is trending up, down, or just going sideways. Many beginners start by watching the 50-day and 200-day MAs.
3. MACD – Watching Momentum Shifts Over Time

MACD stands for Moving Average Convergence Divergence. Don’t let the name scare you—it’s just a way to track momentum using two EMAs. You’ll see lines and a histogram on your chart.
Why it’s helpful:
When the MACD line crosses the signal line, traders often take it as a sign of a potential trend shift. It’s great when paired with something like RSI.
4. Bollinger Bands – A Visual Look at Volatility
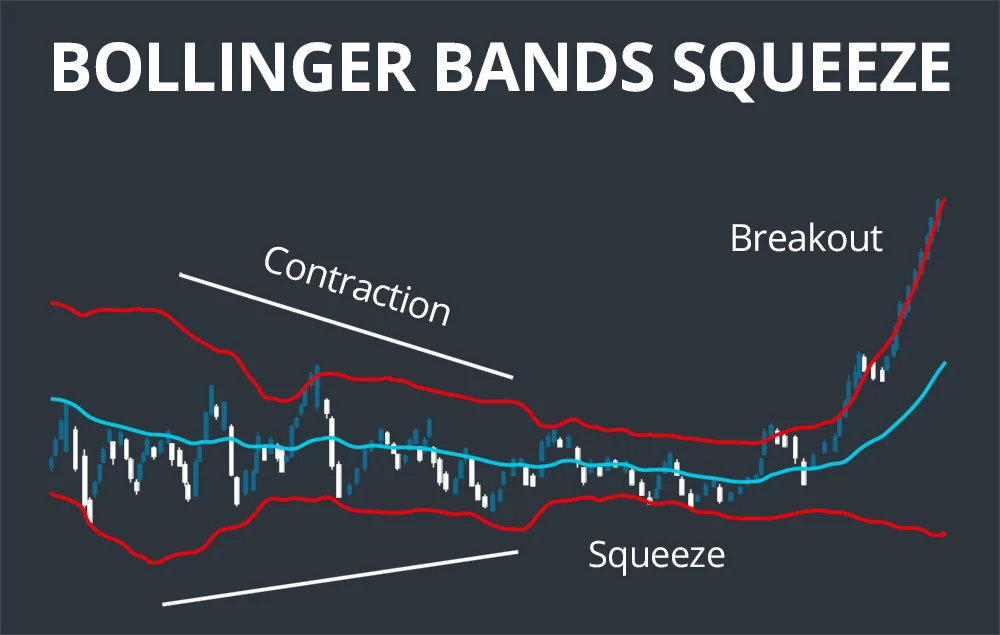
Bollinger Bands are made of three lines: a middle moving average and two bands above and below it. The bands move closer or farther apart depending on how volatile the market is.
Why it’s helpful:
When the bands squeeze tightly, it could mean a breakout is coming. If price hits the outer bands, it might be due for a pullback. A very visual tool for new traders.
5. Stochastic Oscillator – Another Take on Overbought/Oversold

This indicator also shows when an asset might be too high or too low in its recent price range. It uses two lines—%K and %D—to show potential turning points.
Why it’s helpful:
The lines crossing each other can be early clues to a price change. Beginners can use it with RSI to look for confirmation.
6. Volume – An Essential But Underrated Common Trading Indicator
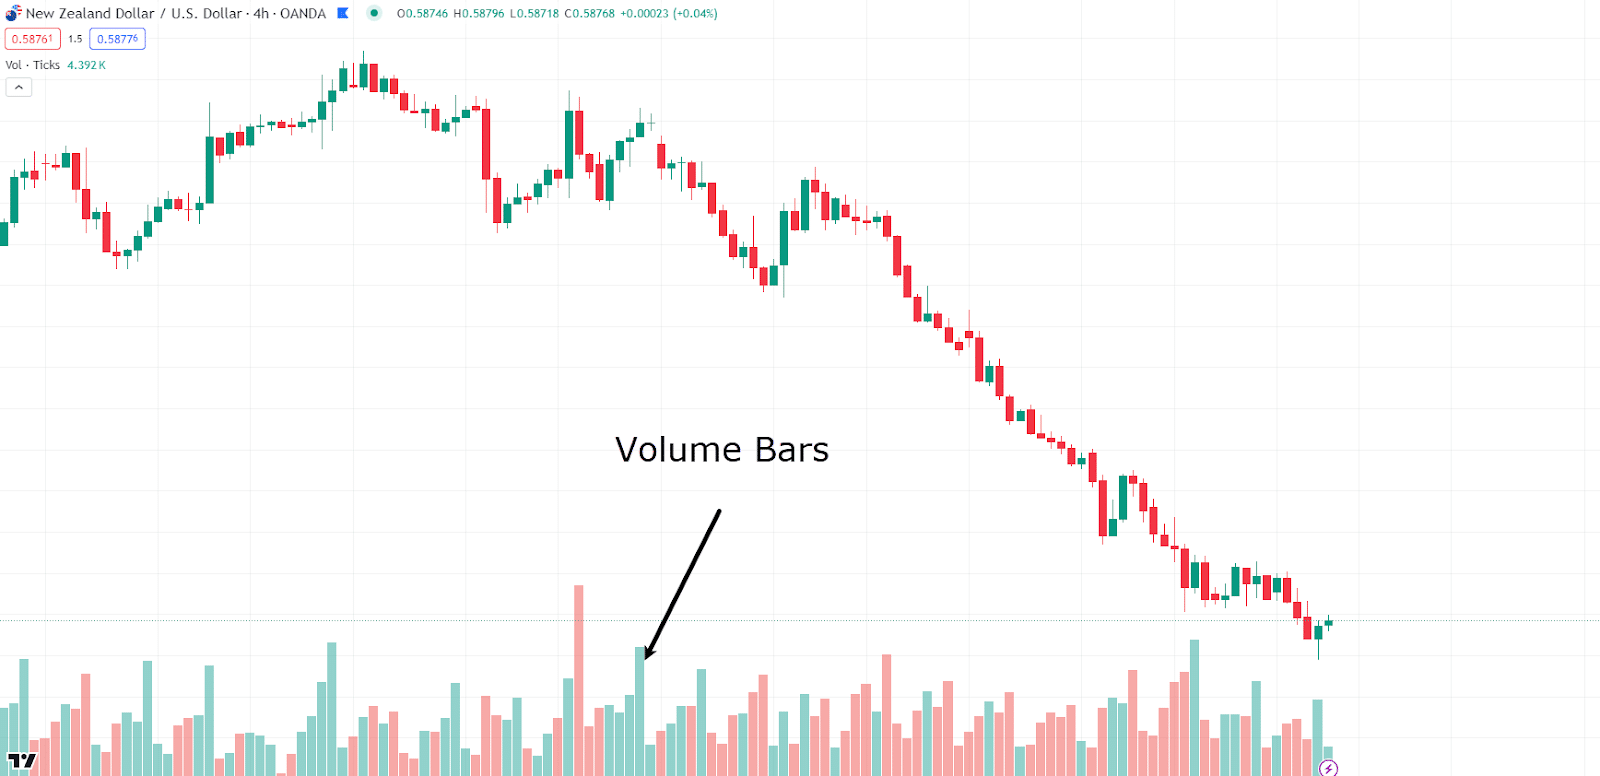
Volume shows how much of something is being traded. A price move with high volume usually means more strength behind it. A move with low volume? Maybe not as reliable.
Why it’s helpful:
Volume adds context to price action. It’s not just about where the price is going—but how strong the move really is.
7. Fibonacci Retracement – A Tool for Finding Support and Resistance
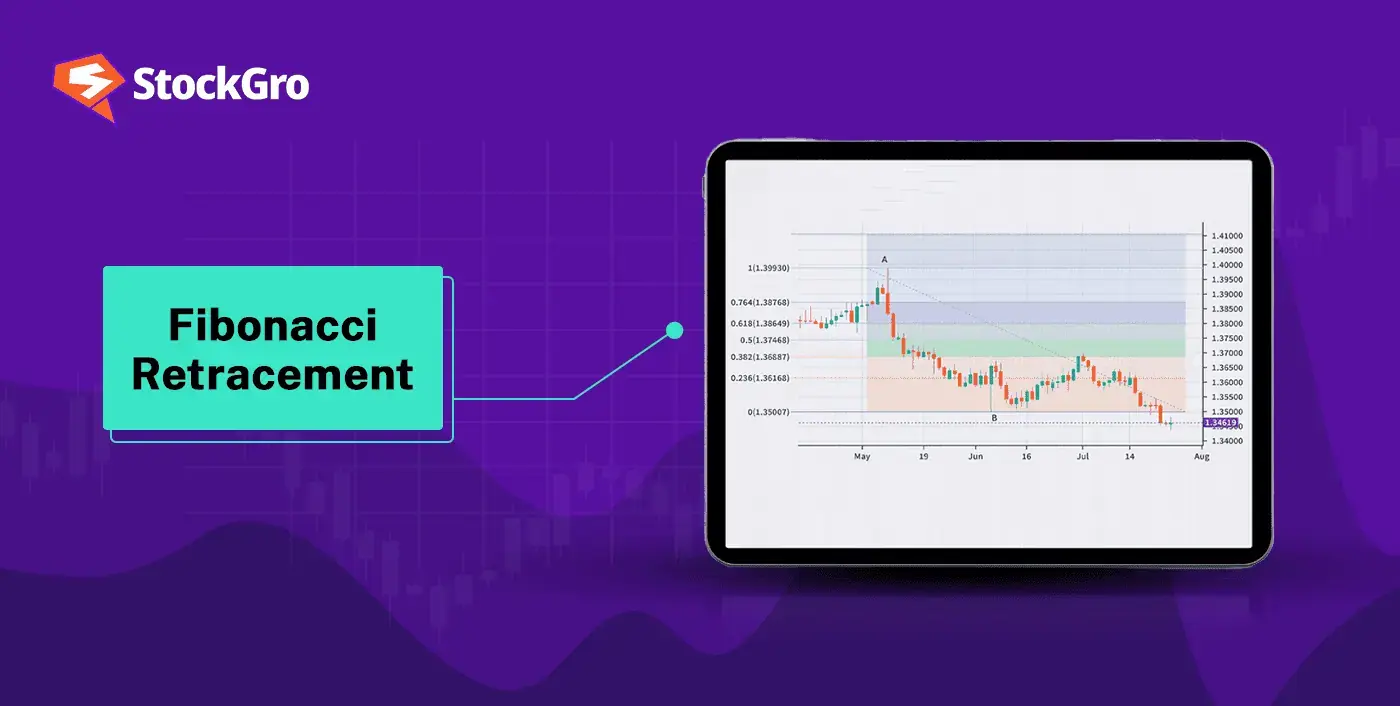
This tool is based on math (the Fibonacci sequence), but don’t worry—you don’t need to do calculations. You draw it between two price points, and it gives you levels that could act like “pause” points.
Why it’s helpful:
Lots of traders use the 38.2%, 50%, and 61.8% levels to spot where price might bounce or reverse. The more people watch them, the more they tend to work.
Conclusion: Learn to Use Common Trading Indicators With Practice
If you’re just getting started, don’t feel pressured to master all the common trading indicators right away. Start with one or two—like RSI and moving averages—and learn how they behave. Test them out. Watch how they react in different market conditions.
Remember, indicators aren’t perfect. They give you clues, not guarantees. But used wisely, they can help you become a more confident, informed trader.
Relevent news: Here